B2C · Web
Energy Switching Tracker
Helping customers understand their energy journey.
After hunting down backend engineers to map a process no one fully understood, I built a customer-facing tracker that replaced reactive 'we'll email you' communication with proactive self-service, saving CS from a lot of anxious phone calls.
At Glance
The problem: Confusion for everybody
Switching energy suppliers in the UK can take weeks: That's just how it works.
So many cogs have to turn for things to happen (old supplier approves the transfer, industry databases get updated, meter readings verified...) and all needs to happen in the right order.
Most energy companies handle this by sending occasional email updates when customers hit major milestones. Simple enough, right?
But then something gets stuck and the time between emails stretches. Customers grow anxious flooding support lines (often for bottlenecks that aren't even the company's fault).
Tomato's problem
unrealiable emailing system
↓ ↓ ↓
Proposed solution
Microsite
Tomato's particular issues
Their email system was unreliable, and nobody could explain how the switching process actually worked.
- Email notifications often failed to send
- Customers had no way to check status except via direct contact
- Support couldn't say "check your email" when emails weren't arriving
- No documentation existed. Not for customer service, not for the rest of the company except backend
The Journey: Milestones
Outcome: Foundational understanding built from zero
The challenges
- Non-UK resident learning the British energy market from scratch
- No one internally could explain the full switching process
- Customer support redirected questions to backend engineers
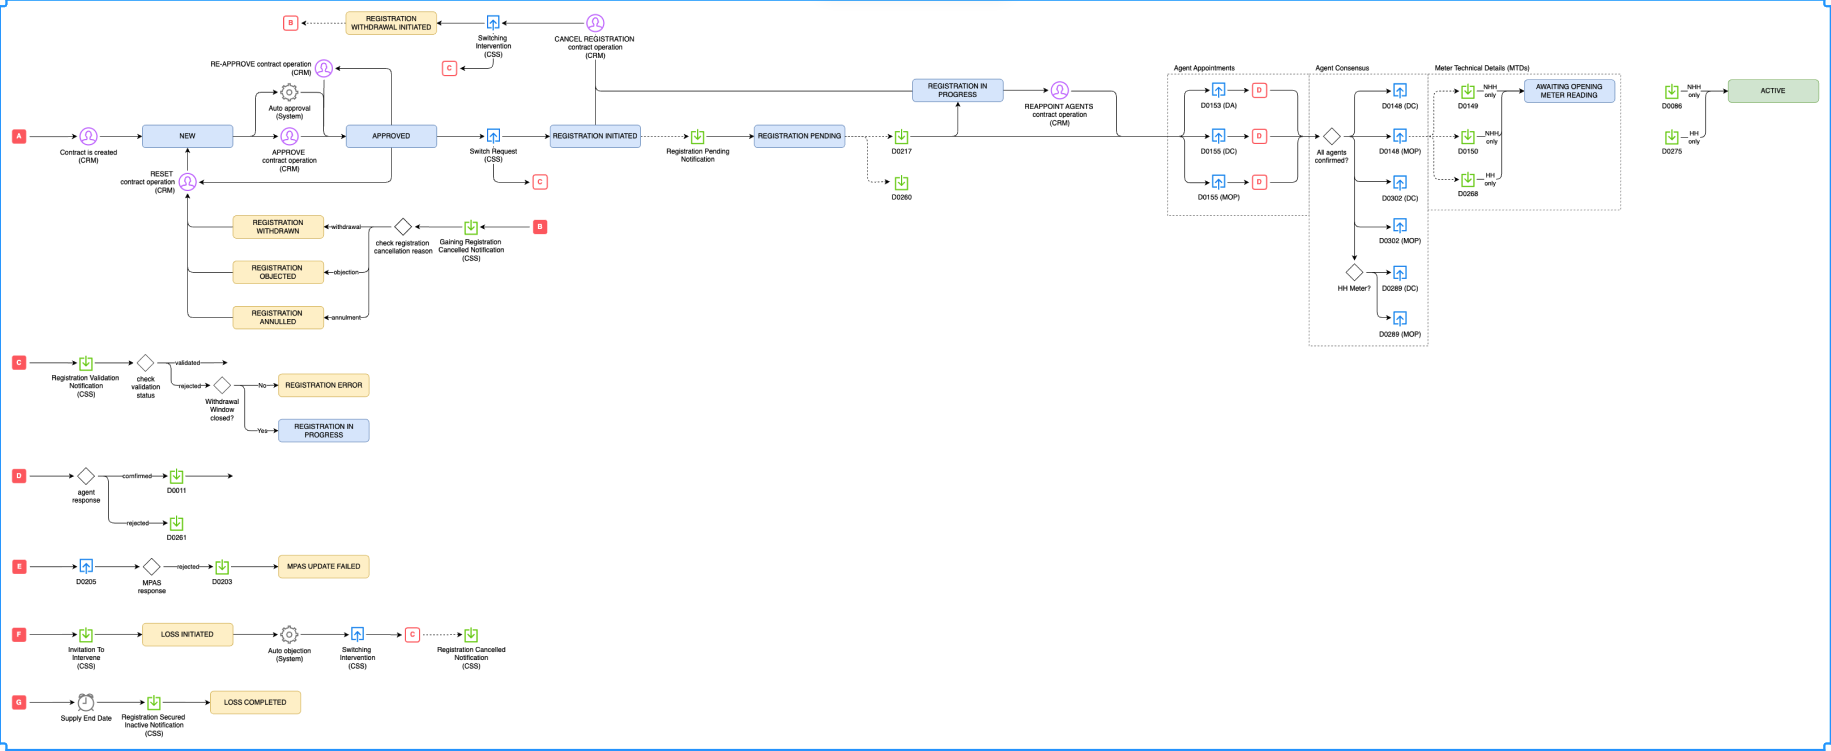
- Only artefact available was a technical flow diagram with no customer meaning
Key learning
You can’t design clarity without first creating shared understanding.
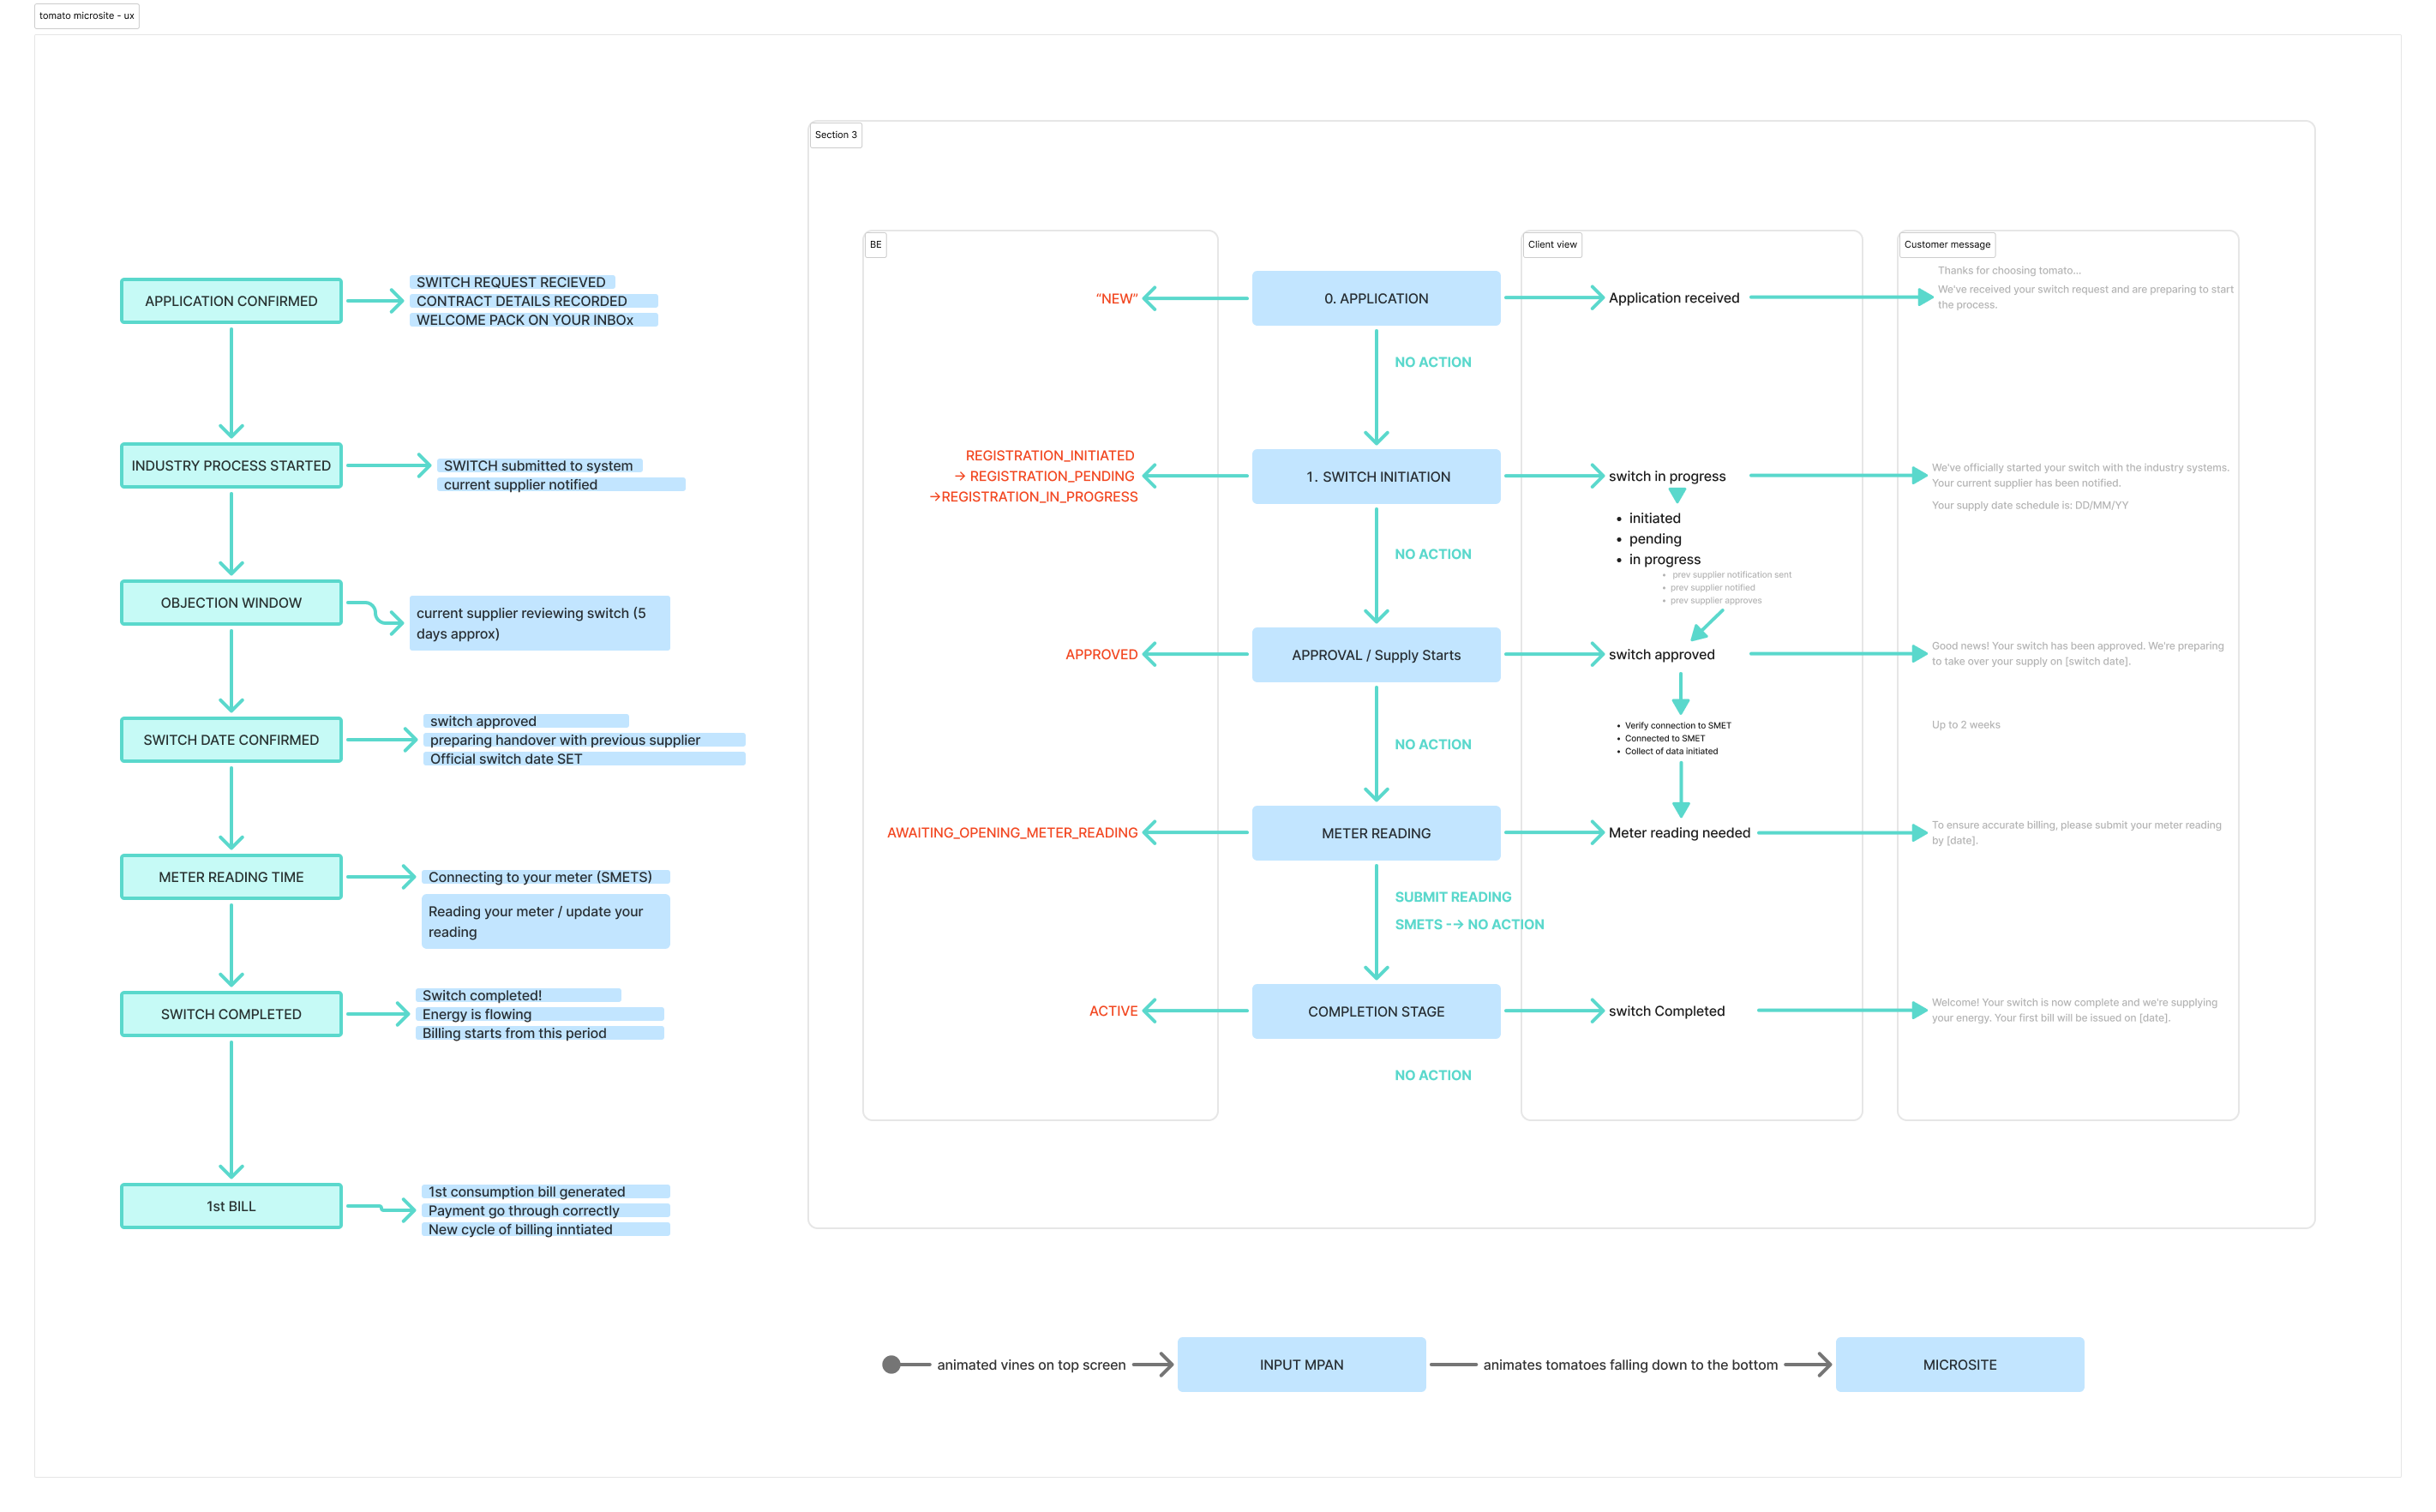
Outcome: Backend logic translated into human language
Milestones
- Translated 15+ backend states into customer-readable language
- Identified two distinct journeys: smart vs traditional meters
- Categorised errors into application, switching, and technical
- Re-aligned with Tomato’s playful tone and brand constraints
Key learning
Design becomes the fastest way to document systems no one can explain.
Outcome: End-to-end journey prototypes covering all states
Milestones
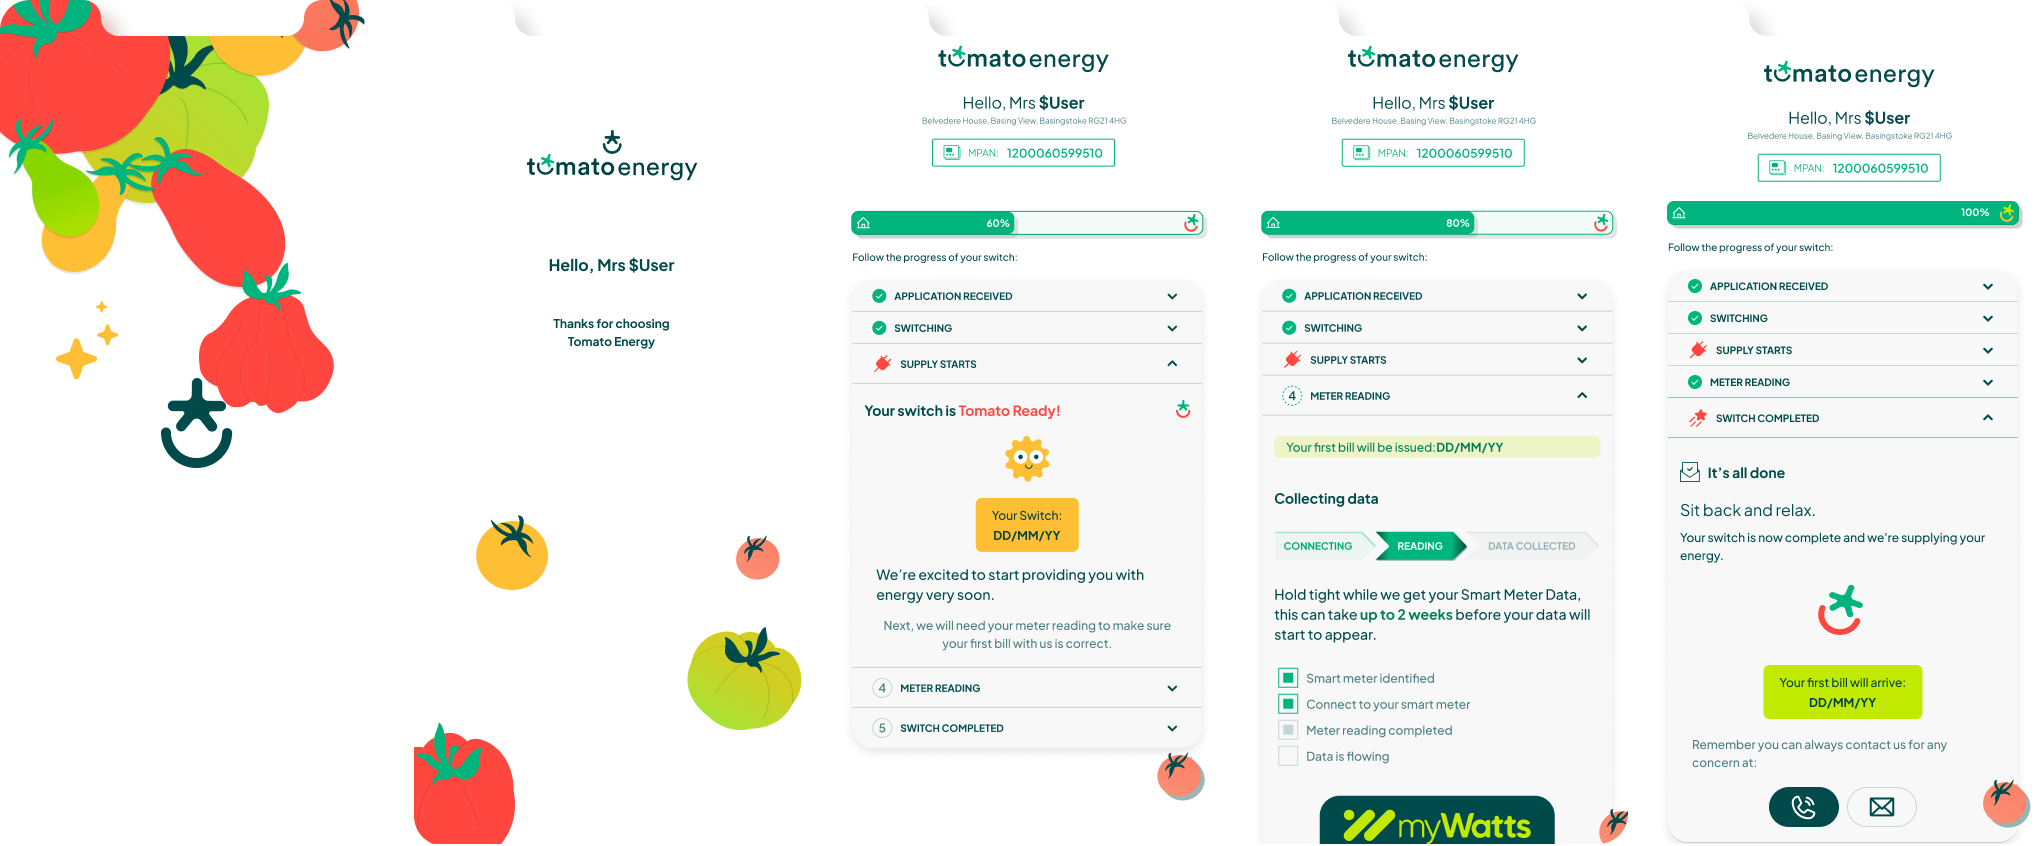
- Designed mobile-first self-service tracking microsite
- Built parallel prototypes for both meter journeys
- Introduced magic-link access to bypass unreliable emails
- Documented micro-interactions and error states in detail
- Added brand-driven loading animations to reduce anxiety
Key learning
Constraints force better system decisions.
Outcome: Clean handoff and shared internal clarity
Milestones
- Stakeholder approval secured
- Comprehensive documentation prepared for future frontend team
- Prototype became single source of truth for switching logic
- Returned to main project after successful delivery
Key learning
Sometimes the most valuable output isn’t UI — it’s shared understanding.
Building Knowledge from Fragments
No one could explain the full switching process; not customer service, not the backend team. As a non-UK native, I had to learn to understand the market from scratch while piecing together system knowledge that even the engineers couldn't articulate.
I created a comprehensive documentation for the company of their own switching process.
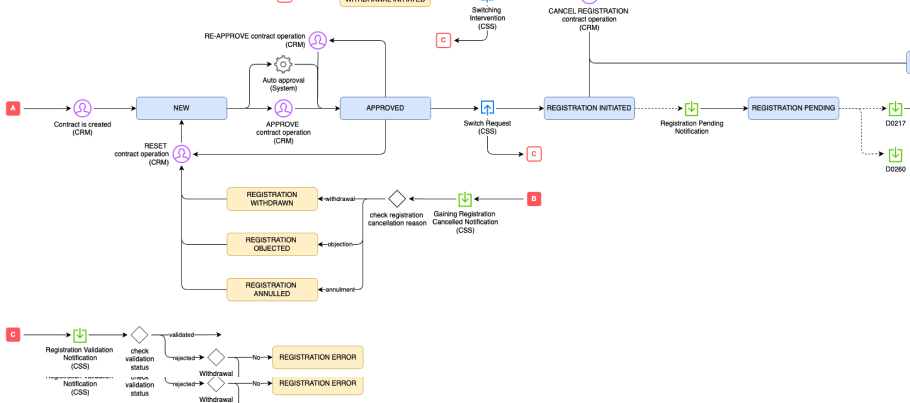
Building Knowledge from Fragments
No one could explain the full switching process; not customer service, not the backend team. As a non-UK resident, I had to learn the market from scratch while piecing together system knowledge that even the engineers couldn't articulate.
→ Result: Created acomprehensive documentation for the company of their own switching process.
Design Explorations and Outcome
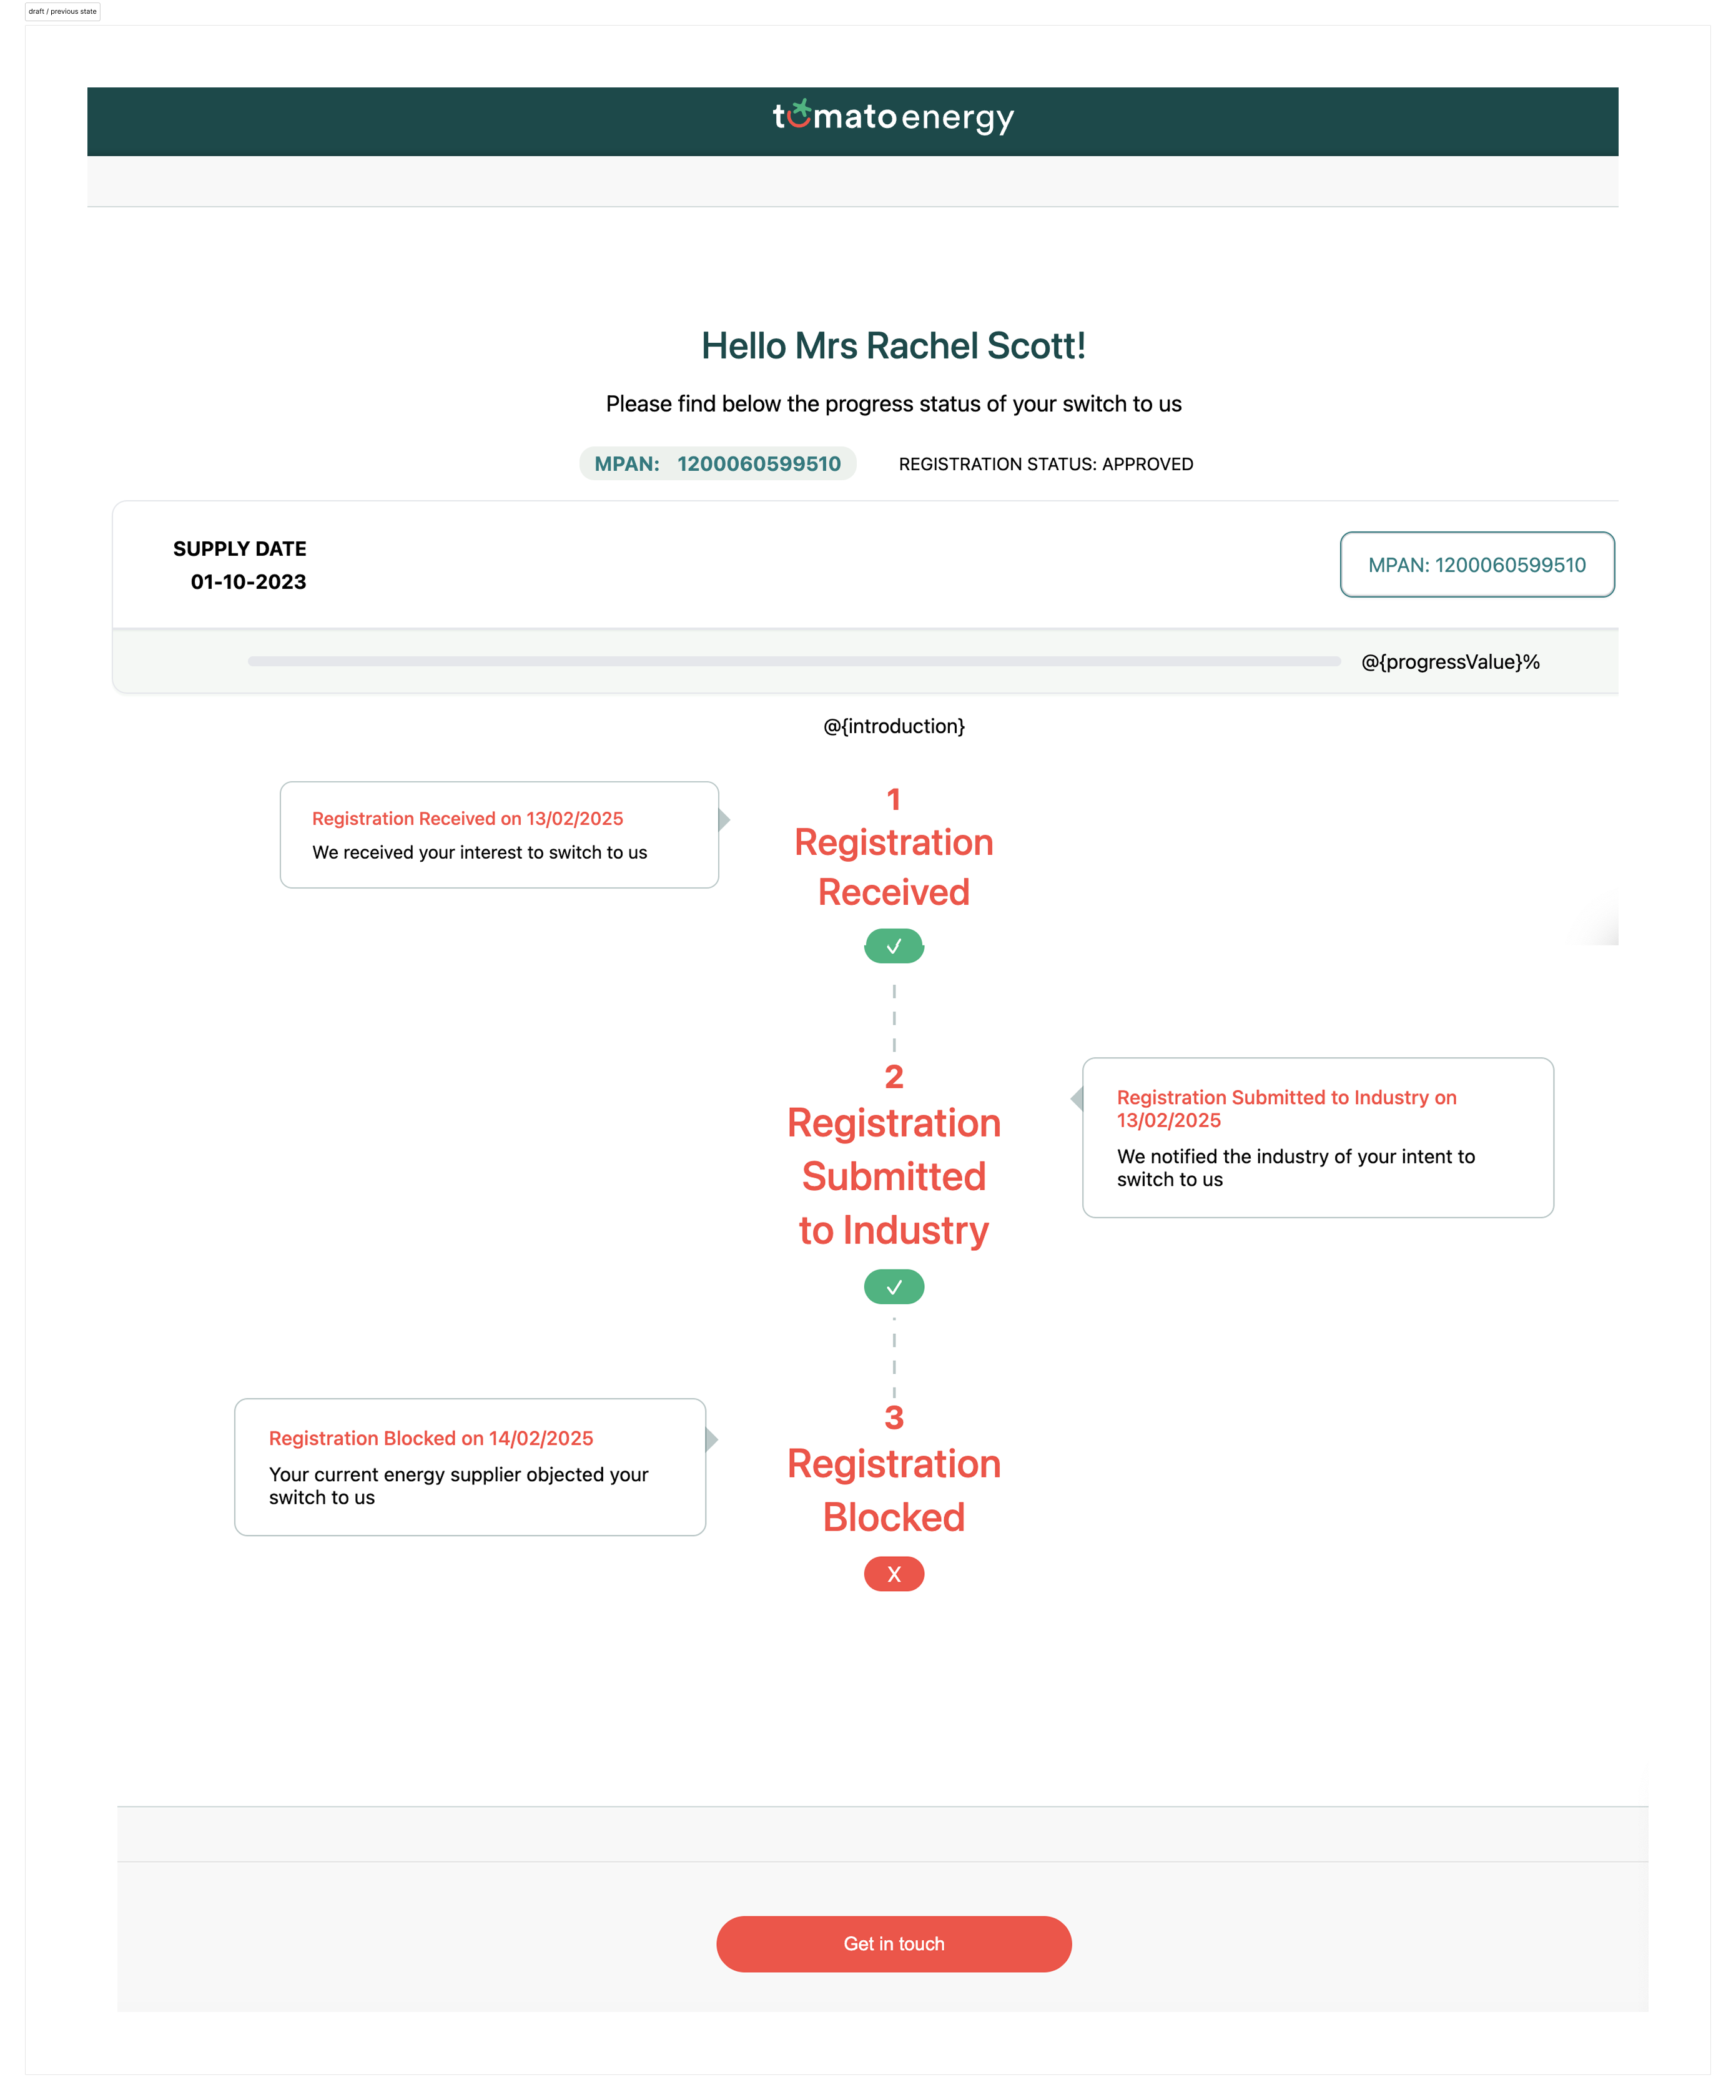
Stakeholders provided an initial draft showing their vision for the tracker—a simple vertical progress indicator. This became the foundation I built upon, adding error handling, dual journey paths, and brand personality.
How much information upfront
> Vertical vs horizontal
> Dropdown vs always visible
> Balancing visual weight
> Maintain playfulness brand
Key design decisions
Stakeholders provided an initial draft showing their vision for the tracker: a simple vertical progress indicator. This became the foundation I built upon, adding error handling, dual journey paths, and brand personality.
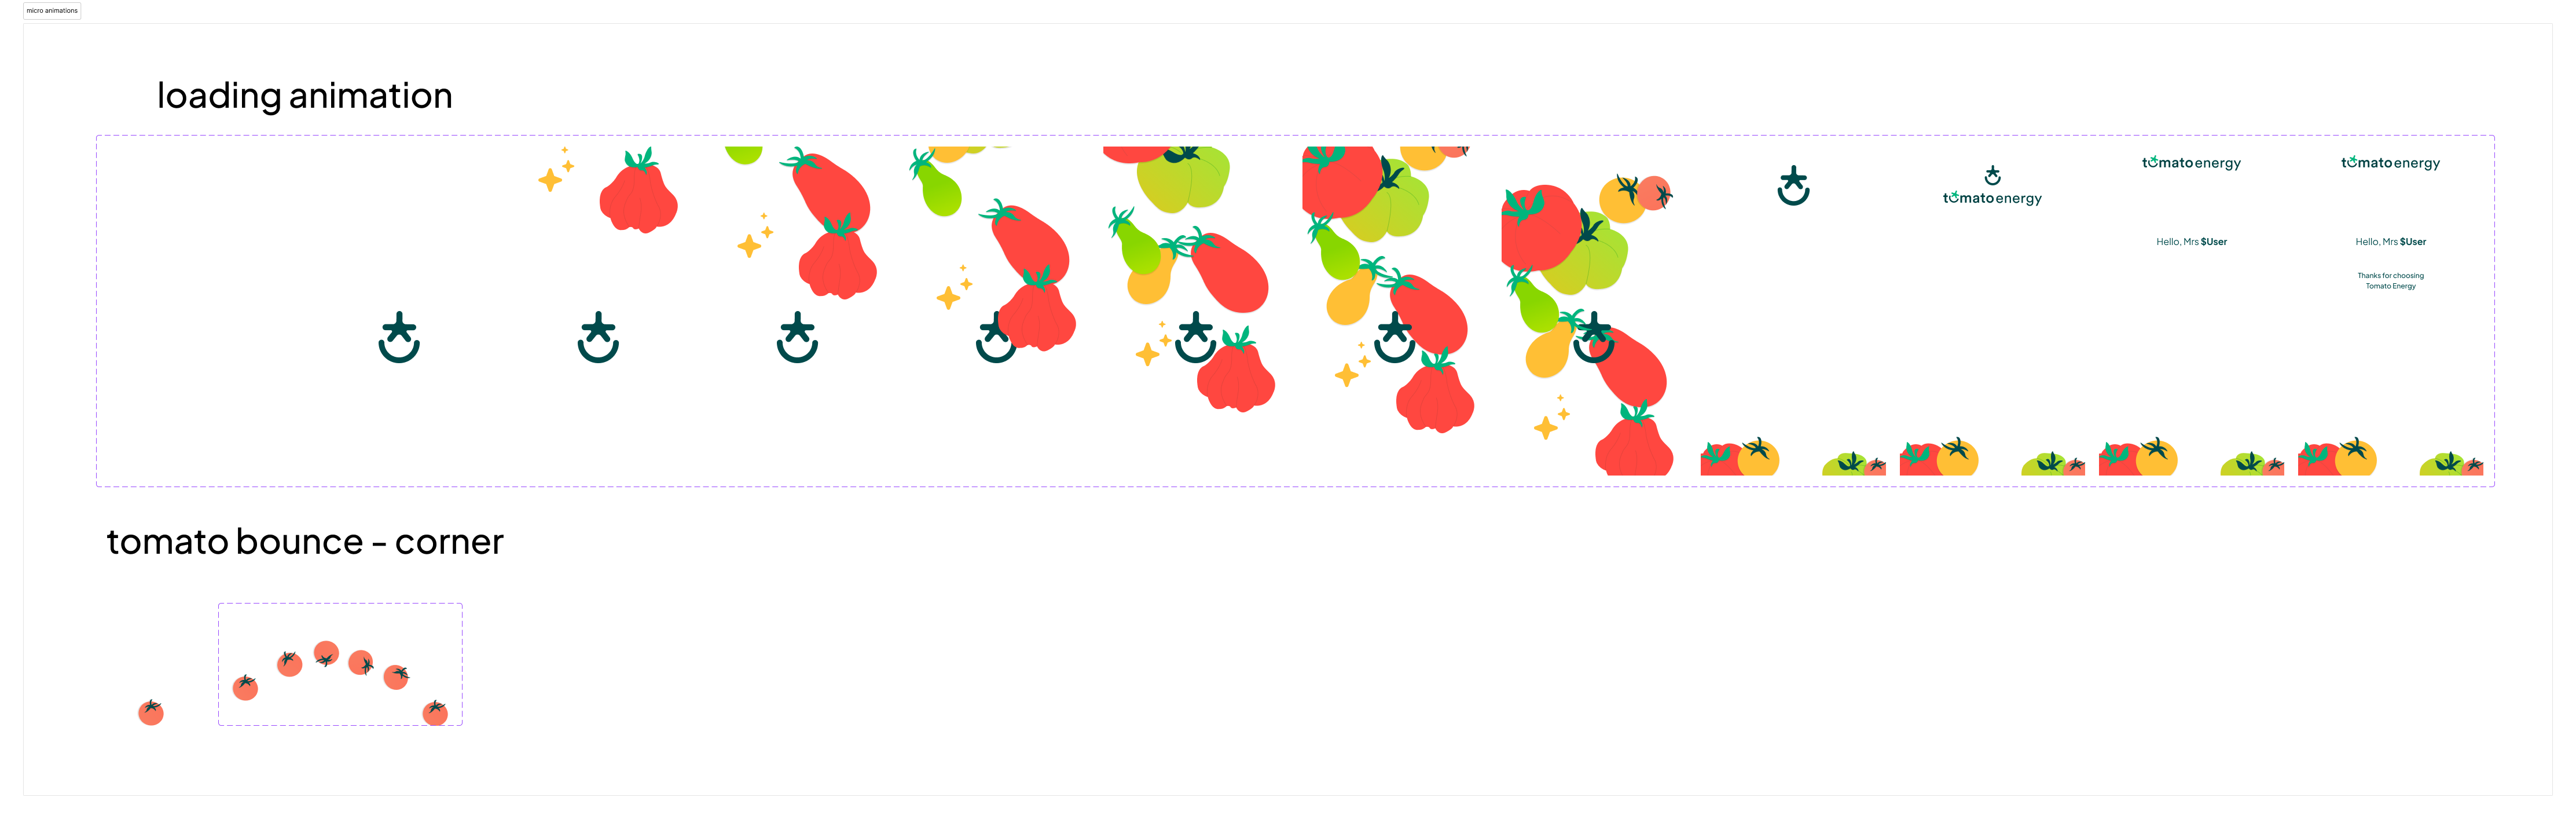
Brand personality
Tomato Energy's identity revolves around being bold and playfull.
In order to preserver those values, and add some visual interest, the design included loading animations — tomatoes falling from the top + a small bouncing tomato at the bottom — to keep personality and attention alive during data fetches and reducing waiting anxiety.
The Change:
Before: Unreliable and Manual
- Multiple (often failed) email notifications
- "Did you get our email?" support tickets
- No visibility into delays or bottlenecks
- Customers in the dark about who was responsible for delays
After: Self-Diagnosis
- One magic link email to personalised microsite
- Direct real-time backend connection
- Clear bottleneck diagnosis showing whose fault and why
- Contextual actions for each state
Wins & Learnings
Solved an Invisible Problem
Created a customer touchpoint that didn't exist before, turning an opaque industry process into something transparent and manageable.
Bypassed a Broken System
Worked around unreliable email infrastructure by designing a single-link solution that gave customers direct backend access—no more "did you get our email?" support tickets.
Empowered Customer Self-Diagnosis
Let customers see exactly where bottlenecks were and whose responsibility they were, eliminating unnecessary "where's my switch?" queries and reducing support burden.
Solo Information Gathering
Pieced together a complex system flow that no single person at the company could explain—starting from ground zero as a non-UK resident learning the British energy market.
Brand Extension
Took scattered brand materials and evolved them into a cohesive, delightful tracking experience that felt unmistakably "Tomato."
Fast, Mobile-First Deployment
Designed for mobile-only launch to get value in customers' hands quickly, proving that strategic constraints can accelerate delivery.
Gallery
Application received - Smart meter journey
Switch initiation - Smart meter flow
Traditional meter with manual reading callout
Application error with actionable next steps
Switching error showing bottleneck source
Brand reference materials showing Tomato's playful personality and visual language
Brand reference materials showing Tomato's playful personality and visual language
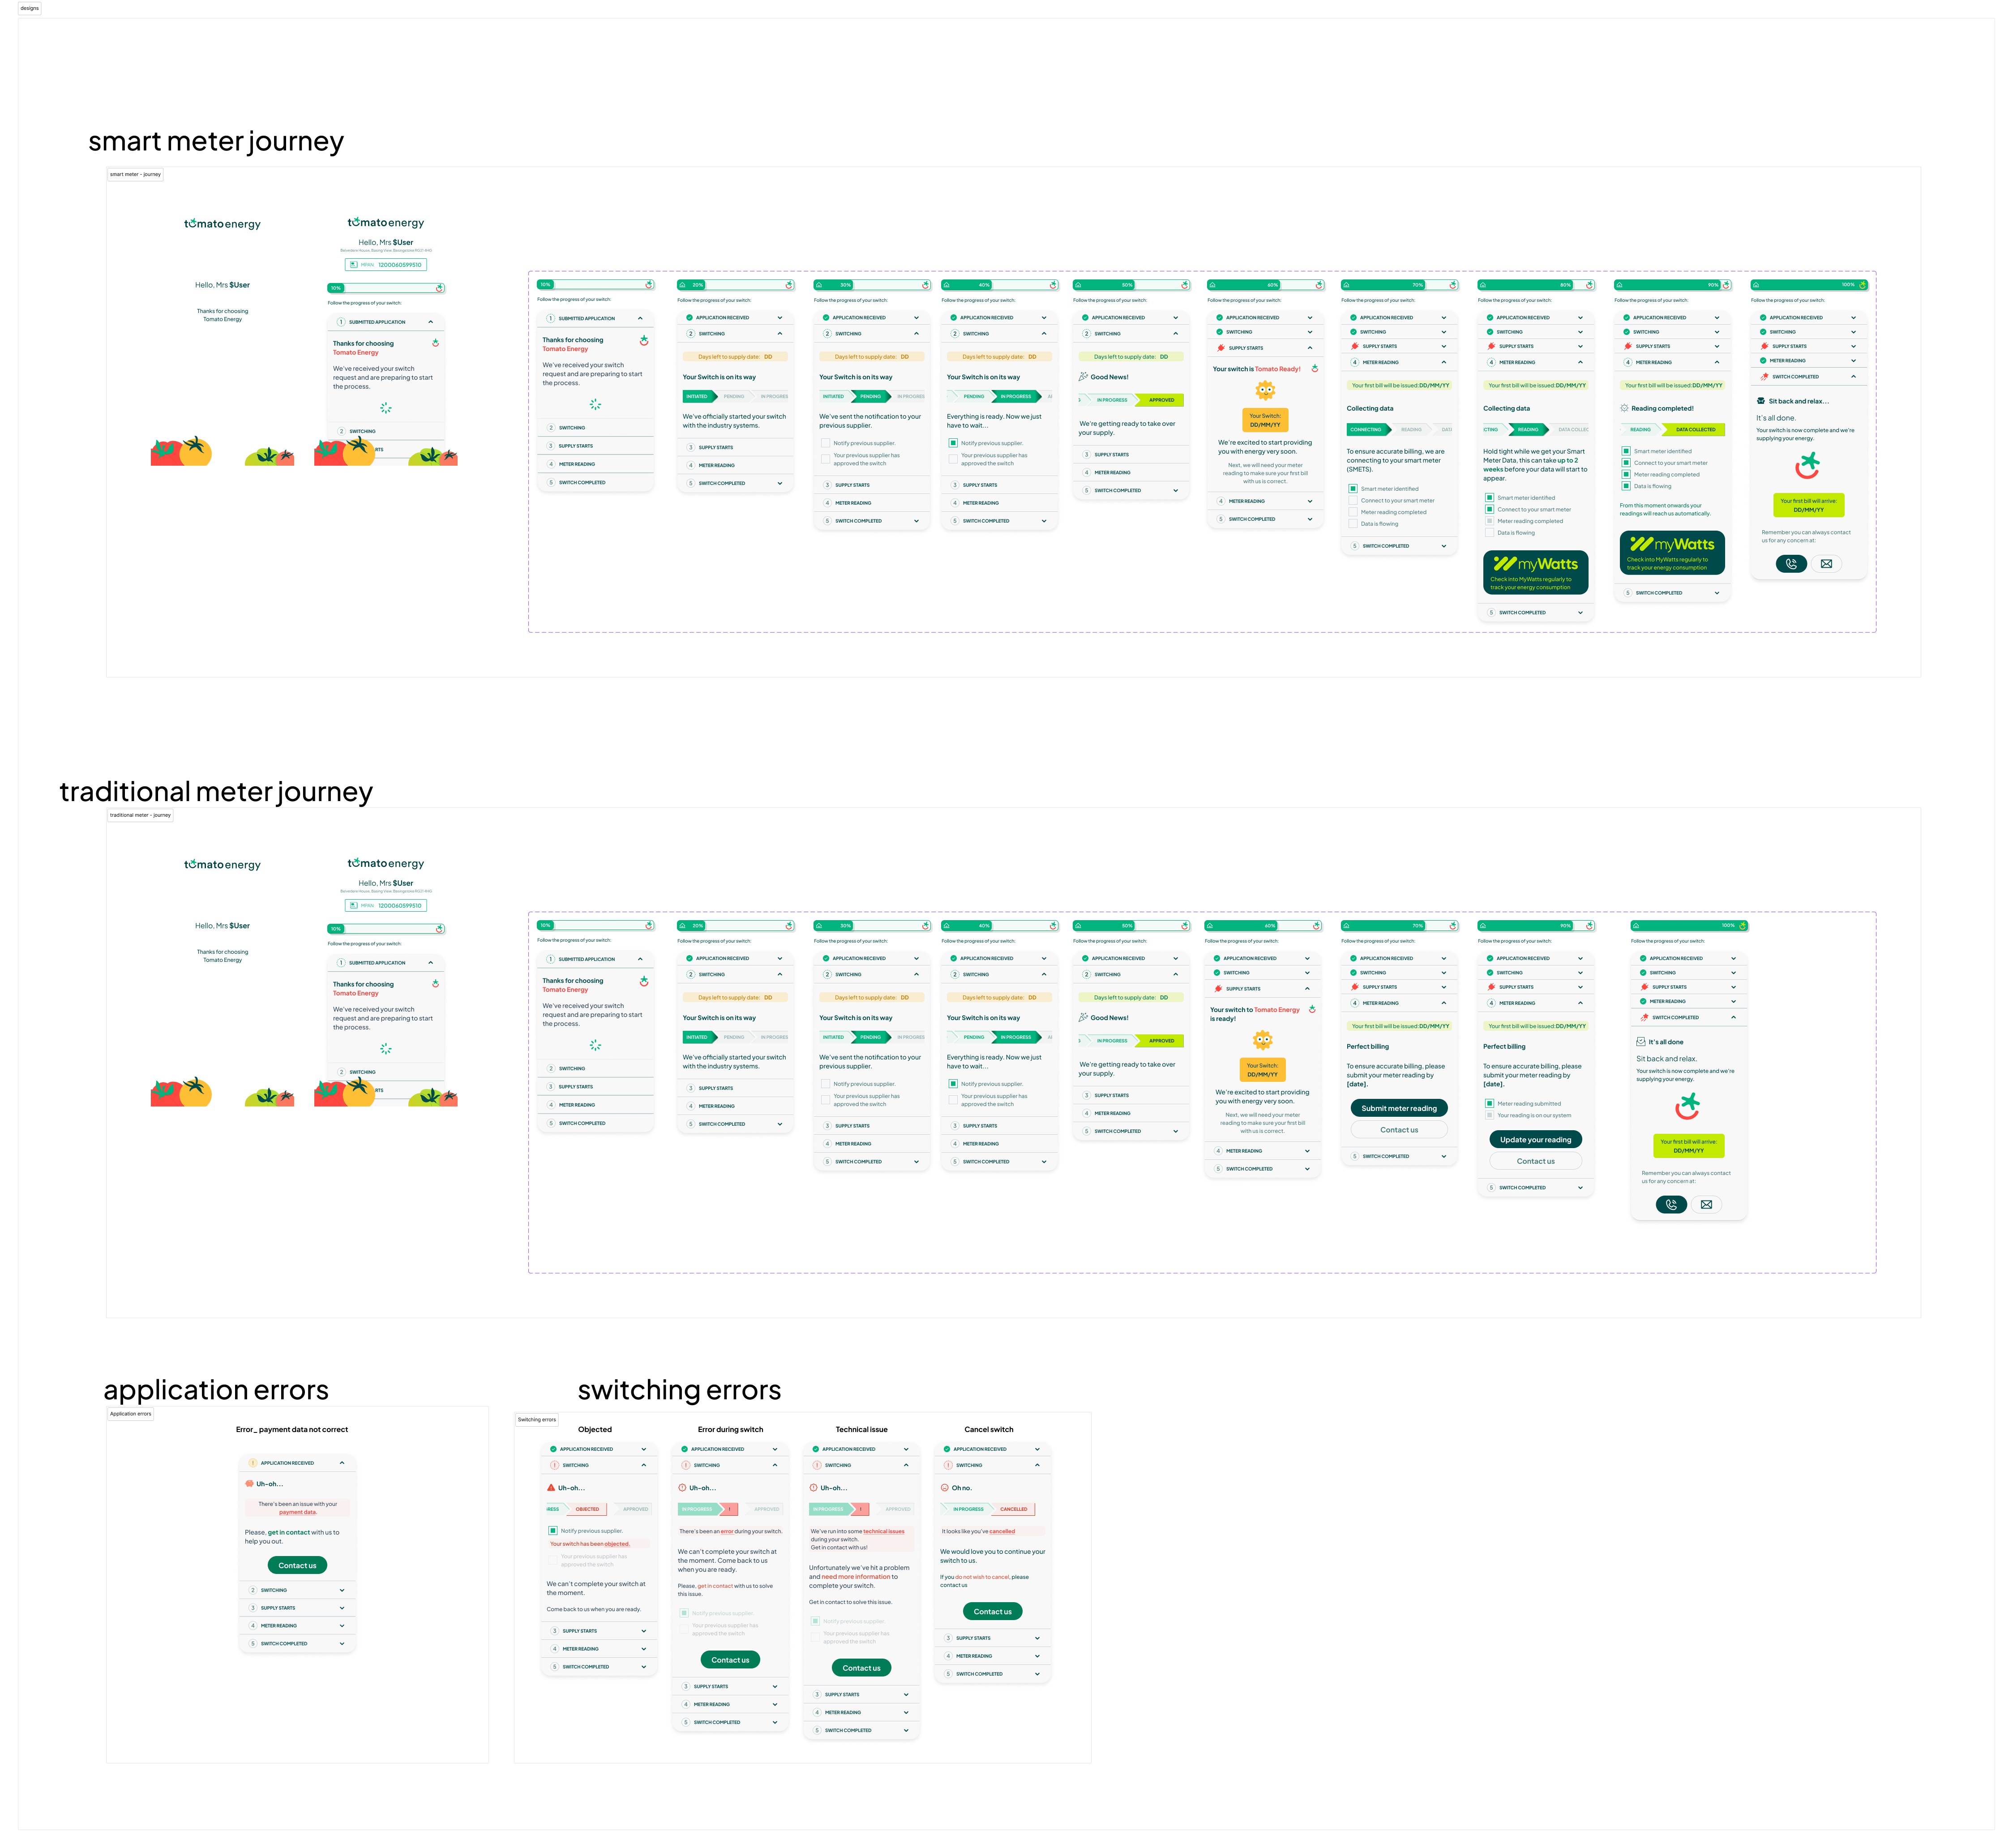
Full UI system: Both journey types with all states and error scenarios